|
MLS |
KRASH PRE-/POSTPROCESSING SOFTWARE |
© Copyright 1992 - 2007 MLS, All
Rights Reserved.
KAP-3 (KRASH Animation Program)
Overview
of the MLS Programs
MLS programs are
designed to run on PCs with MS-Windows operating
system and can be used in conjunction with the standard input and output files
of DRI/KRASH. All MLS programs are compatible with the latest DRI-KRASH
version.
More information
about DRI-KRASH: www.dri-krash.com
|
Program |
Description |
|
MASK |
generates
a KRASH input mask |
|
MASSPLOT |
creates
plots of the KRASH model |
|
KR2NAS |
KRASH to NASTRAN converter |
|
KOMPRASH |
KRASH data compression |
|
KAP |
KRASH Animation Program
|
|
CUTKRASH |
Reduces
the size of the KRASH output file; alters KRWIN output files to be compatible
with older KRASH versions |
|
MLPLOT |
creates
time-history plots |
|
GENFORCE |
calculates
the global forces / moments |
Running the MLS
programs is very easy and comfortable. MASSPLOT, MLPLOT and KAP use pull-down
menus which are selected by pressing a mouse button.
There are a lot of options to change the appearance and the amount of
graphic output. However, you can easily generate a fully annotated chart by
pressing a mouse button only 3 times. For example - Create a model plot with
MASSPLOT or KAP: Select a file (2 clicks), place the cursor on DRAW and press
the button again - that's it.
All fonts and printers supported by Windows can be used with the MLS
programs.
The
KRASH - MLS Concept
MASK
3.0
The program MASK
generates a KRASH input mask which is based on the input format described in
the 'DRI-KRASH / KRWIN User's Guide'.
To create a new KRASH
input mask, the user has to fix the number of used KRASH elements in cards 40 -
80 and 140. MASK reads these cards and completes the input file with cards 200
- 5000. The MASK output file includes all required KRASH input cards in correct
number and order.
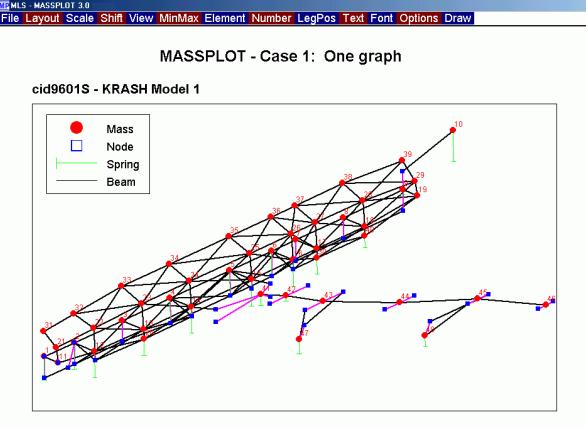
MASSPLOT
MASSPLOT generates plots of the KRASH model
using the standard KRASH input file. This file does not have to include all
input cards - basic information about masses, beams etc. is sufficient to run
MASSPLOT. Therefore, the program is a useful tool during the model development
phase.
Masses, nodepoints, beams, springs and DRI
elements may be selected from the ELEMENT menu to be displayed singularly or
all together. All these different element types may be numbered (=> NUMBER
menu).
The VIEW menu offers
5 standard views of the KRASH model or any user-defined orientation of the
model. To look at details, the user can zoom into the model and define the
viewable window with the MINMAX menu.
KRASH models using the RUNMOD=2.0 option (card 110, half airplane input)
are displayed as full airplane models. The plot includes element numbering of
the second half model.
Different KRASH files may be selected at the same time and displayed on
one page with up to 4 graph windows (CASE 2). These windows may also be used to
display one model in different views.
![]()
|
Menu |
Purpose |
|
File |
Select / drop file / Print / Quit program |
Creating
a Bitmap file
A Windows Bitmap file (*.bmp) is created by clicking the right mouse button inside the graphic window. The bitmap files will be named MLS001.BMP ... MLS999.BMP.
KOMPRASH
3.0
KOMPRASH is the
KRASH DATA COMPRESSOR. It reads the KRASH ASCII output file as well as all the
KRASH binary output files and generates the KOMPRASH binary output file (KRFILE.KPR)
which is used by the KRASH Animation Program KAP.
KOMPRASH files include all time-history data of the different KRASH
output files as well as the basic model data (masses, beams, springs etc.).
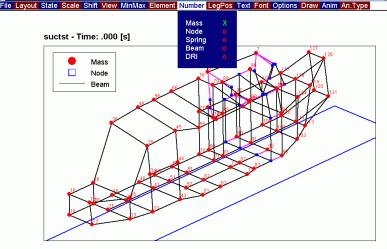
KAP-3
(KRASH Animation Program)
|
KAP-3 Features ·
KAP shows the
movement and deformation of the KRASH model. ·
The colours of the
KRASH beams are dynamically changed to show the amount of forces. ·
With this feature,
the user can easily identify the locations of maximum load. ·
For fast data
access, KAP works with the binary direct access files generated by KOMPRASH. ·
KAP is a Windows
program and has access to all Windows fonts and printers. ·
The graphics which
are generated by KAP can be saved in a Windows bitmap file by simply clicking
the right mouse button inside the graphic window. ·
With this feature,
it is possible to generate a video (AVI file) or animated GIF file. The
UH-1H KRASH model in this example was generated by Dynamic Response, Inc.,
CA, USA.
|
|
KAP-3 Menus
File Layout State
Scale Shift View MinMax Elem Num LegPos Text Font Options Draw Anim An.Type
|
Menu |
Purpose |
|
File |
Select / drop file
/ Print / Quit program |
ANIMATION
TYPE
KR2NAS 1.0
CUTKRASH
4.0
The program CUTKRASH
reduces the size of the KRASH output file (ASCII) by removing the printer plot
symbols (‘*’, ’=‘, ’+’) and unnecessary blanks from the time-history data
block. This procedure reduces the file size by up to 40 - 70 % and takes only a
few seconds.
In the latest version, another feature was added to CUTKRASH. The
program alters the KRWIN ASCII output files in such a way that they are
compatible with older KRASH versions running under the DOS operating system
(e.g. KRASH9602, KRASH97).
With this capability, KRWIN output files can be
used together with MLPLOT versions 2.4 / 2.5.
MLPLOT
2.5
MLPLOT 2.5 creates line charts of all
time-history data stored in the KRASH output files. 87 different types of KRASH
data may be plotted with MLPLOT. By default these data use ‘time’ as x-axis,
but you can specify any other dataset as well. For example, you can plot spring
forces dependent on spring compression.
If you select
different data types (for example forces and accelerations) you can have up to
4 differently scaled (and labelled) y-axes with one graph or up to 4 single
graph windows on one page. The data may be selected from up to 10 different
files.
KRASH output data that may be plotted with
MLPLOT
|
ENERGY |
SPRING
|
|
HEAD IMPACT |
OLEO |
MLPLOT
- Graphics screen menus
|
Quit
Scale Shift Layout
MinMax Join LegPos
Text Special Device
ReDraw |
|
MENU |
PURPOSE |
|
Quit |
Go back to DATA SCREEN. |
|
Scale |
Multiply all values with factor (default = 1.0). |
|
Shift |
Add value to all data (default = 0.0). |
|
Layout |
Number of graphs on output page, Y-Axes, X-Base. |
|
MinMax |
Define minimum and maximum values of axes (zooming). |
|
Join |
Give same attributes (color, line type) to different
data |
|
LegPos |
Define position of legend inside the graph (9
possible positions). |
|
Text |
Title, legend and axes text can be changed by user
input. |
|
Special |
Grid, (background-) color, line type, units
(English, metric etc.) |
|
Device |
Output on screen, printer or Windows bitmap file
(*.bmp). |
|
ReDraw |
Command starts graphics output using current
settings. |
Trademarks
DRI/KRASH and KRWIN are trademarks of Dynamic
Response, Inc., CA., USA.
CUTKRASH, MLPLOT, MASSPLOT, KAP, MASK, and
KOMPRASH are trademarks of MLS, Boeblingen, Germany.